
| Categories | Laravel, Web Application | |
| URL | Launch Project |
Project Description
ATE Dashboard Report is an online dashboard that provides a real time updates of ATE(DSL/LTE) summaries for every region in the Philippines. It consist of different reports such as measurement of Ping Latency, DNS Response, Web Page Download, Video Buffering and Web Page Login.
The project helps the admin to be able to see where is the location that have an slow internet.
Initially, they only using an excel sheets to be able to do the process of the data. They are doing it buy manually exporting the data from the database.
My Responsibilities:
- Develop Mysql query that fetch records from the database according to certain criteria.
- Optimising the query and apply indexing concept since it fetch records almost 10GB.
- Integrating the computed summary to the front-end UI to display the calculation along with different color.
- Optimising the load time of the site from 1 minute into 5 seconds.
- Managing the Deployment of the Project to client server.
Technology stack used:
- Laravel 5.2
- HTML and CSS
- Bootstrap
- AdminLTE
- Mysql
Challenge Encounter
Not really good in manually sql query
Some of the challenging part in developing reports in the application is creating a complex query from the large datasets. At the beginning I’m not yet really good in creating a complex query in mysql but I’ve manage to do it by reviewing the basics of query.
Loading Time Optimization
Since it have a lot of data, it takes a lot time of time to be able to process and load the summary of information . Around 1 minute and 30 seconds. So I need to find a way to make the query faster using indexing technique in the database.
When I used the technique it really helps to make the dashboard load faster ( around 5-6 seconds only ). This is huge improvement on their end because they don’t really need to wait a lot of time to see the updates on the informations.
Screenshots
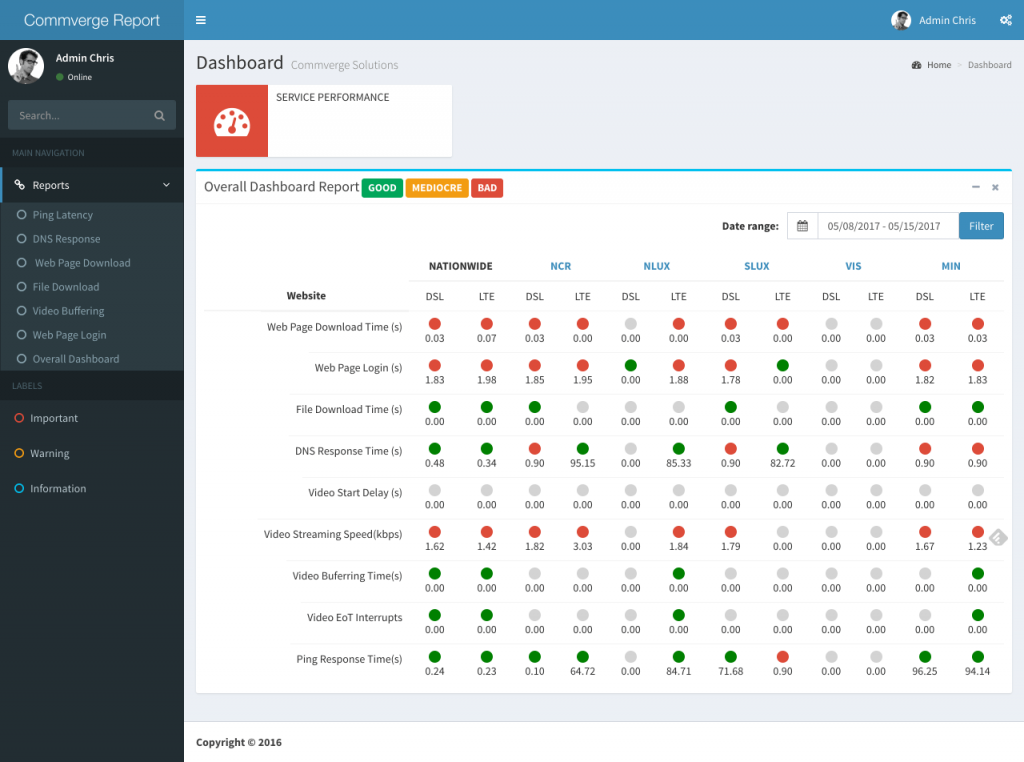
Overall Report Page . It shows all of the summary of different reports available in the dashboard

Login Page. Only person with the credentials could be able to access the dashboard.
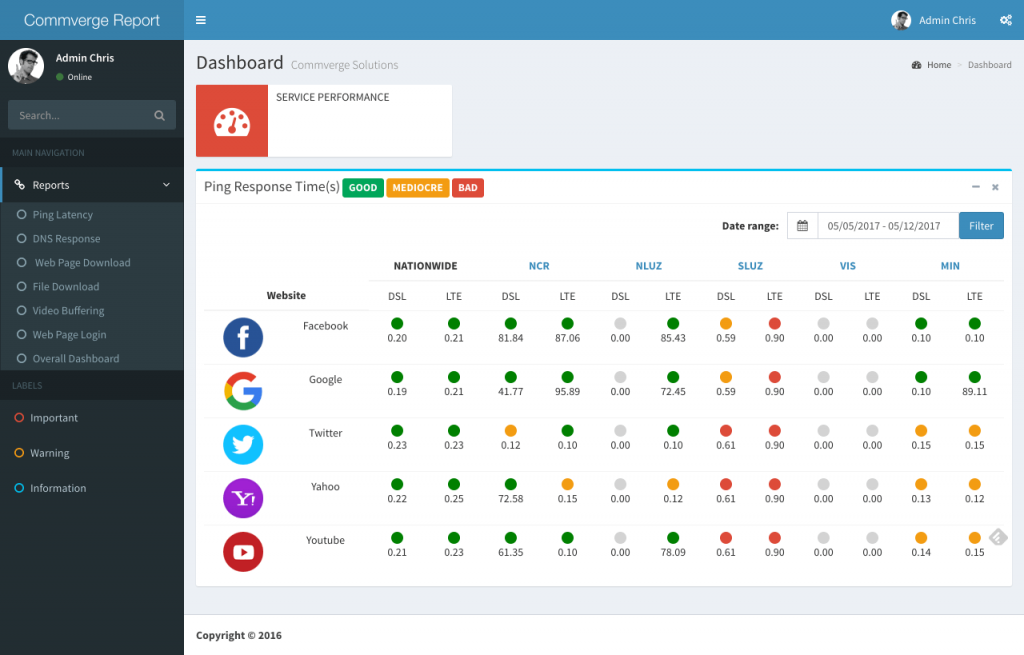
Individual Report Page. It shows a single report for one report like the Ping Response Time.
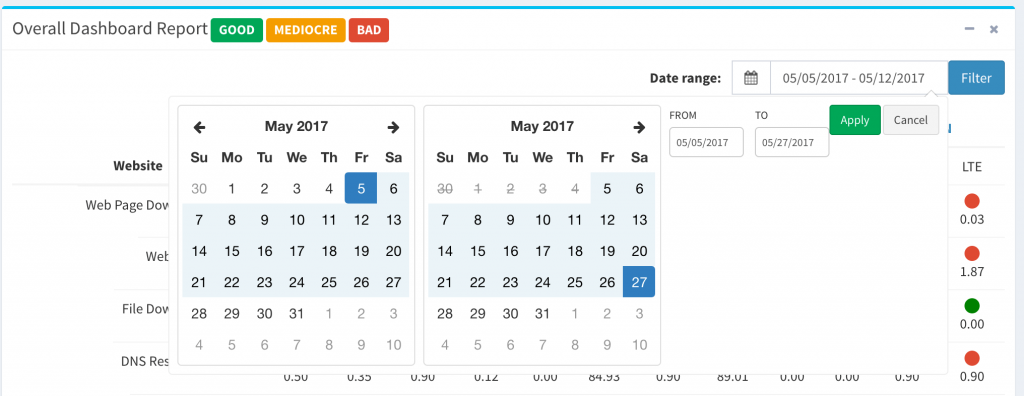
Report Date Range Filter . It shows the date range filter that could be use in order to filter the records that needs to be shown. By default the records only display 1 week.
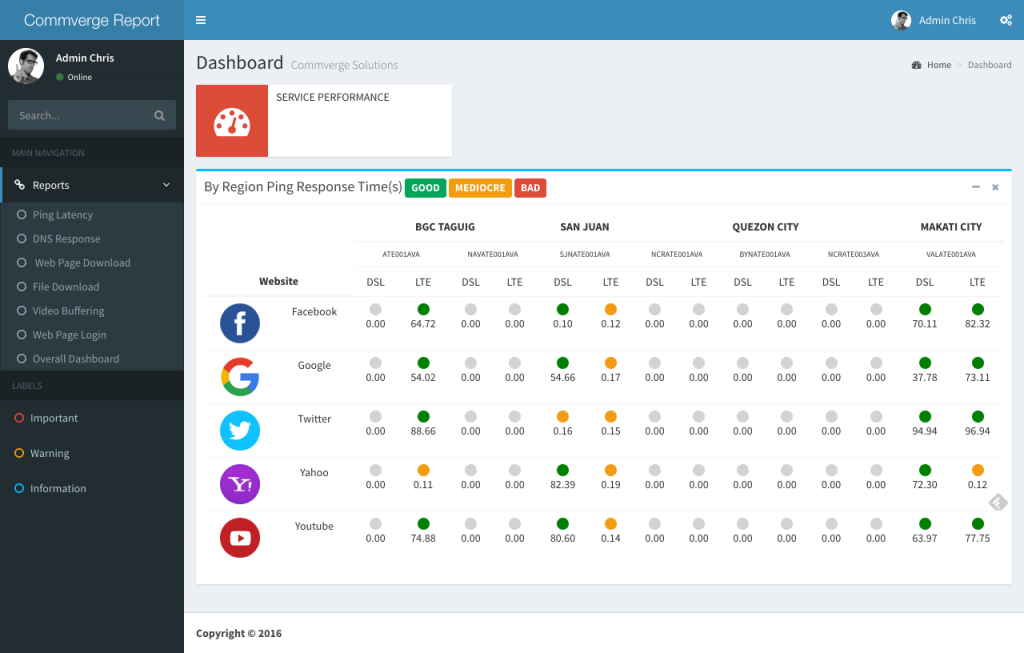
Report Drill Down Records . This is the additional page where the details for each region will be show. Since Philippines have a lot of region it is being group according to it’s location.